Top Places to Buy Cheap Houses in USA, 2019
Houses in this country can be had for far cheaper than almost anyone realizes.
My favorite such example comes from Upstate NY native Christopher Baus: “The house I was born in sold for $4000.”
The house my parents owned when I was born recently sold for $4000. I’m not omitting a zero or two. That’s about the price of a used 2001 Honda Civic with 150,000 miles – maybe the Honda is worth a bit more. My parents sold the house for $12,000 (three zeros) in the ’70s. Times have been tough for as long as I can remember my hometown of Jamestown (about 60 miles from Buffalo), NY, but I still found this surprising.
That was 6 years ago but Jamestown’s real estate market hasn’t changed much since: Zillow lists 264 properties that have recently sold for less than $15,000. For example, here’s one that went for $6,500 and appears liveable, and there are similar listings currently for sale, like this one for $10,000.
Jamestown, NY, then is certainly a place to buy cheap houses but is it the best place? Perhaps we can do better.
Defining the “Cheap” in “Cheap Houses”
Deciding which home is cheapest is surprisingly nuanced. Consider, which of these is the best deal?
The house with the…
- lowest initial purchase price.
- lowest total cost of ownership, i.e. an aggregate of the initial price, lifetime repairs, property taxes, and other expenses.
- best ratio between price and its cost-to-replace.
- lowest ratio of price to the area’s median income. Zillow takes this tact in their “affordability” ranking, a metric they define as the “share of median income that residents pay for a 30-year fixed mortgage on a typical home.”
- largest price gap between it and an average of what similar houses have sold for.
- largest return on investment at re-sale.
- largest return on investment, when rented out.
Trick question, sorta. Which is optimal depends crucially on the preferences of the would-be buyer (a point I make in more detail in my guide to the best place to buy homesteading land.) This article, then, is necessarily opinionated as I have my own prejudices here. I’ll share one of my strongest with you:
I hate ranking housing by its profitability as an investment. “Housing as investment” is an altogether monstrous idea. Cultures that believe in it end up enacting policies that artificially inflate existing home prices, much to the detriment of everyone else. Examples of such policies include restrictions on building and bans on everything-but-single-family-homes. The result is the creation of a system that exerts python-like constriction on the American dream, suffocating it through the gradual replacement of the self-sufficient home-owning class with a desperate renter-class forced to funnel their wages to rent-seeking parasites. At best. At worst it ends in dystopias like the Bay Area, where shitting on the street is permitted and building a patio isn’t.
Plus, it’s just too damn hard. Such measurements depend crucially on forecasting the future and accurate estimation of the preferences of other people, tasks that posses a recursive difficulty reminiscent of an Escher-painting. They’re always tougher than you expect.

No thanks!
We’ll be better served by taking the simplest metrics and then gradually adding complexity from there. Let’s try that. Let’s start with the easiest thing that could work.
Regions With the Lowest Median Purchase Price
Zillow publishes quite a bit of economic housing market data. One of their available measures is the “Zillow Home Value Index (ZHVI): A smoothed, seasonally adjusted measure of the median estimated home value across a given region and housing type.” It’s straightforward to extract a ranking of regions by median home price from this data, so that’s what I tried first.
[table id=6 /]
Measured this way, Danville, IL ends up as the #1 cheapest place to buy a house. Coincidentally, it’s about an hour drive from me and I’ve visited a few times, so I’ll give you my impression of the place.
Location-wise, the most interesting thing about the town is its proximity to Indiana. It’s right on the Illinois side of the state’s border. At first I thought this might explain its cheapness: given that taxation is significantly higher on the Illinois side, maybe Danville’s residents are all moving to Indiana and selling their houses for cheap on the way out. I plugged Danville into the government’s Census Flows Mapper to check.
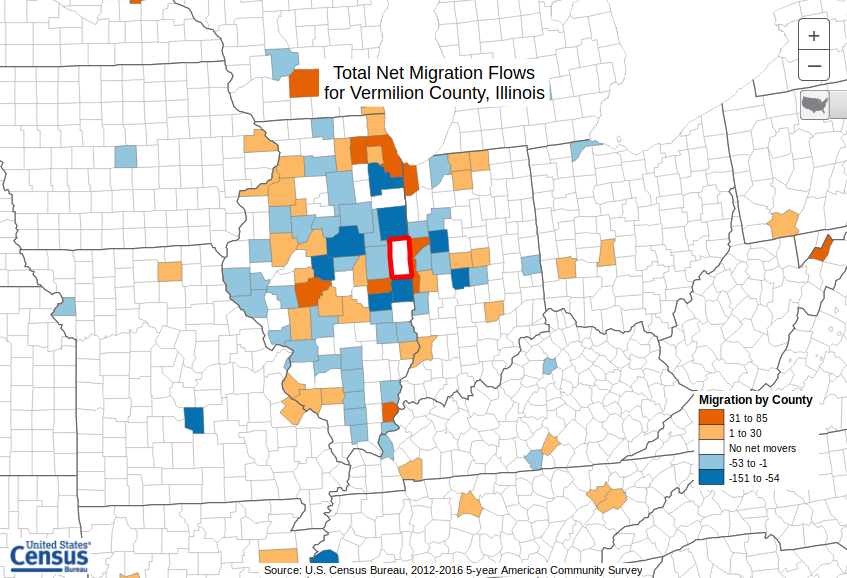
Nope! The result is the opposite of what I anticipated. There are more people from Indiana moving to Danville than the reverse.
Is this ranking any good? How does Danville, IL compare to Jamestown, NY?
Our first attempt has Jamestown at #4. Promising! But is Danville really cheaper?
A Zillow search for houses under $15,000 returns 224 results for Danville, IL. Jamestown NY meanwhile has ~17% more such listings, at 264, even though Danville is larger by about 2,000 residents. On the one hand, this is the opposite of what we should anticipate. On the other, from browsing Danville’s Zillow results, its real estate market certainly appears comparable to Jamestown’s. Both cheap.
So should you move to Danville? Probably not. It’s the only place in rural Illinois where I’ve gotten the sort of vague unease I associate with crime-infested urban neighborhoods. Here it appears my gut was unfortunately right: “Danville has one of the highest crime rates in America compared to all communities of all sizes.” This is significantly worse than the earlier example of Jamestown where crime, though elevated, is not nearly so bad.
We can do better.
Leaving “Median” Behind
If you are interested in a cheap house, you presumably have no intention of paying that area’s median price–you want a deal–so why create a median-based ranking?
Zillow can again help us out here. Their data helpfully splits each market into thirds: a top tier, middle tier, and bottom tier. Instead of considering the market as a whole, we can narrow our analysis to median prices for “bottom tier” houses, i.e. the cheapest third of that region’s market.
[table id=7 /]
Restricting ourselves this way, we’re sort of following the adage that advises one to buy the worst house in the best neighborhood. Like with any popular wisdom, though, there’s also a cliche that implies the opposite. One may prefer to be the “biggest fish in a small pond.”
If we can invert our proverb, maybe we ought to invert our data too? Let’s re-run the numbers above for the “top tier” third of the market instead of the bottom tier and find out.
Doing so, we’re answering a new question, “Where is it cheapest to have a nicer house than your neighbors, to not just keep up with the Joneses but be the Joneses?”
[table id=8 /]
The Most Bang For Your Buck
According to the US Census, the size of the median house varies regionally. They’re largest in the Northeast and smallest in the Midwest, 2,336 sq ft vs 2,001. The gap between rural and city houses is even larger with, surprisingly, houses inside “Metropolitan Statistical Areas” larger than those that aren’t.
This is a potential source of bias in our rankings: maybe some regions are doing well because they’ve mostly small houses.
Depending on your preferences, this may or may not be a problem. Would you rather buy the absolute cheapest house you can find or the most house for your dollar? The rankings above optimize for the first, the absolute cheapest house you can find.
What if you want the most bang for your buck, though, even if that means you have to shell out a few more bucks? We can answer this second question by ranking regions based on housing’s price per sq ft instead of its purchase price, like so:
[table id=9 /]
There’s Jamestown again, at #6!
What do these numbers mean? They’re easier to make sense of with some context: On average, building a new home costs about $150/sq ft but this number varies significantly with region, i.e. costs are an enviable $80/sq ft in Oklahoma, the state boasting the cheapest home construction.
This means that, in many regions, houses can be had for significantly less than it would cost to re-build them. Compared to $17/ sq ft, assembling a new house of the same size would cost you almost 5x as much, at a minimum. That’s like an 80% discount! What a steal!
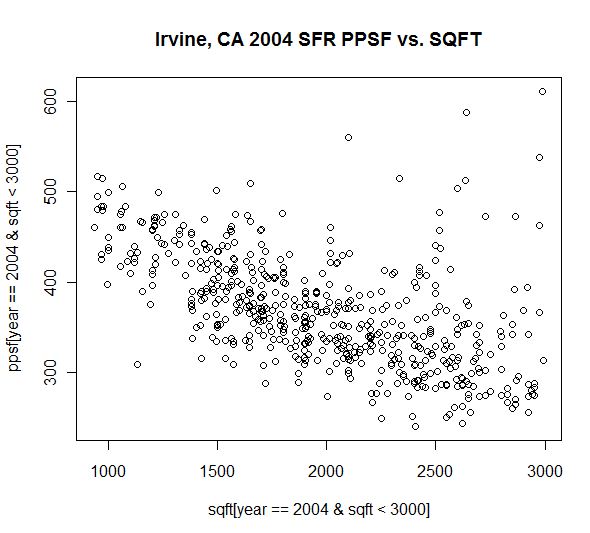
This ranking is still imperfect, though. It’s biased toward large houses, because the marginal cost of a sq ft of house decreases as the size of the house increases. This makes sense when you think about it: fixed costs, like utility hook ups and permitting, are identical but contribute more to the average cost per sq ft of a small house than a large one. The bigger the house, the more sq ft there are to dilute these expenses.
Here’s a graph of that relationship between price per sq ft versus # of sq ft that was shared by globaldecision.com. As you can see, as the sq ft of a house increases (the y axis) the price per sq ft goes down (the x axis).
Can we do better? Yeah, probably, but it’d be a lot more work now that we’ve exhausted the simplest analyses. Next, it’d make the most sense to go more fine grained and evaluate specific houses instead of whole regions, maybe by training a predictive model to estimate prices and then using it to identify mispricings.
Except I’ve already built something like that elsewhere.
Further Reading
- I’ve written software that can help you discover cheap houses. Check it out.
- If you’re interested in purchasing raw land, you’ll benefit from reading my guide to selecting homesteading land.
- “How Many Years of Life Does That House Cost?”
- The New York Times has an excellent “rent versus buy” calculator.